






As of this writing, the average 30-year fixed mortgage rate stands at 7.24%, according to Freddie Mac's Primary Mortgage Market Survey for the week ending October 29, 2026 — back up after a brief dip in September. Across the Lake Texoma region, that means higher borrowing costs are colliding with rising inventory in several counties, giving today's buyers more room to negotiate than they've had in some time, even as sellers in a few pockets are still seeing solid year-over-year price gains. This month we're also expanding our coverage to all twelve counties Love My Texoma Home serves — here's how conditions look across every one of them, from Collin County, TX down to Pushmataha County, OK.

Freddie Mac's most recent Primary Mortgage Market Survey, covering the week ending October 29, 2026, put the average rate on a 30-year fixed-rate mortgage at 7.24%, with 15-year fixed rates averaging 6.60% over the same week (Source: Freddie Mac PMMS). Rates have climbed back up since mid-September, when the 30-year average sat closer to 6.95%. Bottom line: these are national averages, not a quote for any individual borrower — your actual rate depends on credit, loan type, and lender, so talk to a local lender for a current, written quote before assuming what you'll pay.
Here's the number driving a lot of the "is this a buyer's market or a seller's market" conversations right now: nationally, there are 63% more active home sellers than active home buyers — the biggest gap on record since Redfin started tracking this in 2013. As of September 2026, Redfin counted roughly 1,510,784 home sellers nationwide versus about 928,892 home buyers, and 41 of the 50 largest U.S. metro areas are now technically buyer's markets (Source: Redfin, "Home Sellers Now Outnumber Buyers By 63%," September 2026).
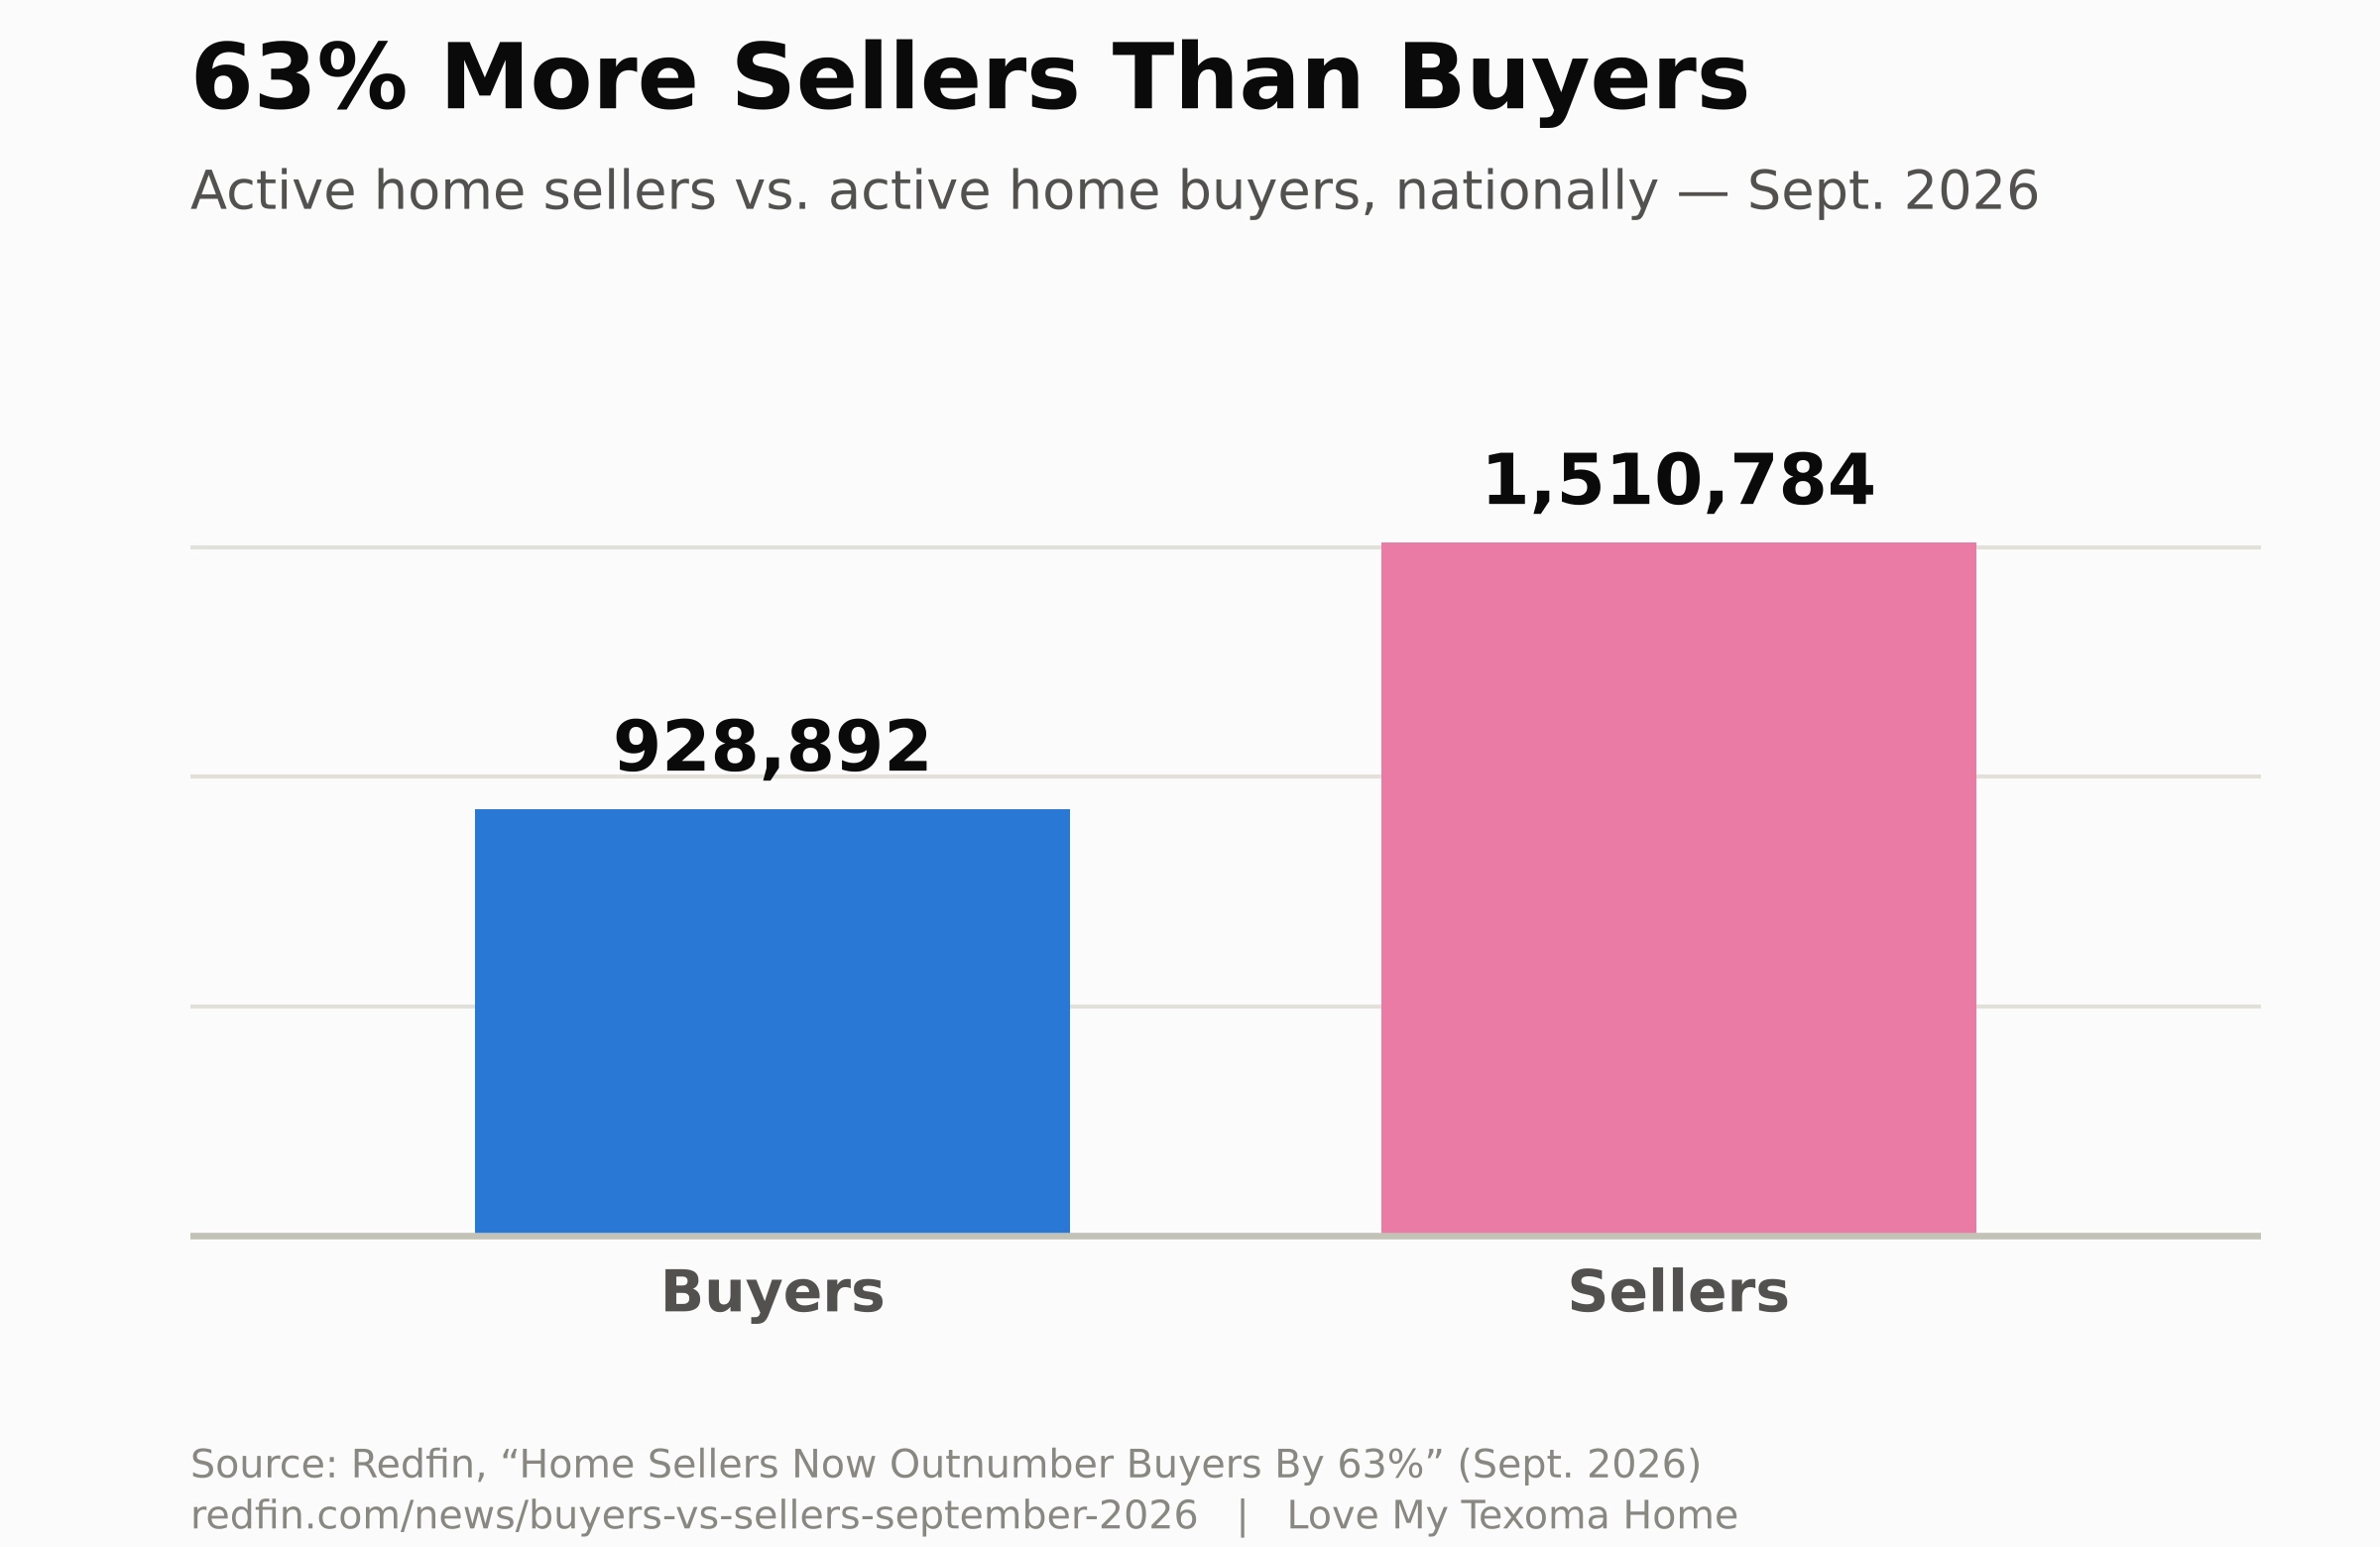
That's a national figure, not a Texoma-specific one — and it's worth being straight about that. Our local counties are smaller, slower-moving markets where a handful of sales can swing the numbers, which is exactly why we break out county-by-county data below instead of assuming the national headline applies evenly everywhere. But the direction is the same story we're seeing across most of our service area: more homes sitting, more days on market, and more room for buyers to negotiate than at almost any point in the last several years.
Grayson County Housing Market Overview (Zillow, data through september 30, 2026)
| Typical Home Value (Zillow Home Value Index) | $280,311 |
| 1-Year Value Change | -4.6% |
| For-Sale Inventory | 1,470 (September 30, 2026) |
| New Listings | 234 (September 30, 2026) |
| Median Sale-to-List Ratio | 0.978 (August 31, 2026) |
| Median Sale Price | $283,279 (August 31, 2026) |
| Median List Price | $336,505 (September 30, 2026) |
| Percent of Sales Over List Price | 13.5% (August 31, 2026) |
| Percent of Sales Under List Price | 66.9% (August 31, 2026) |
| Median Days to Pending | 67 (September 30, 2026) |
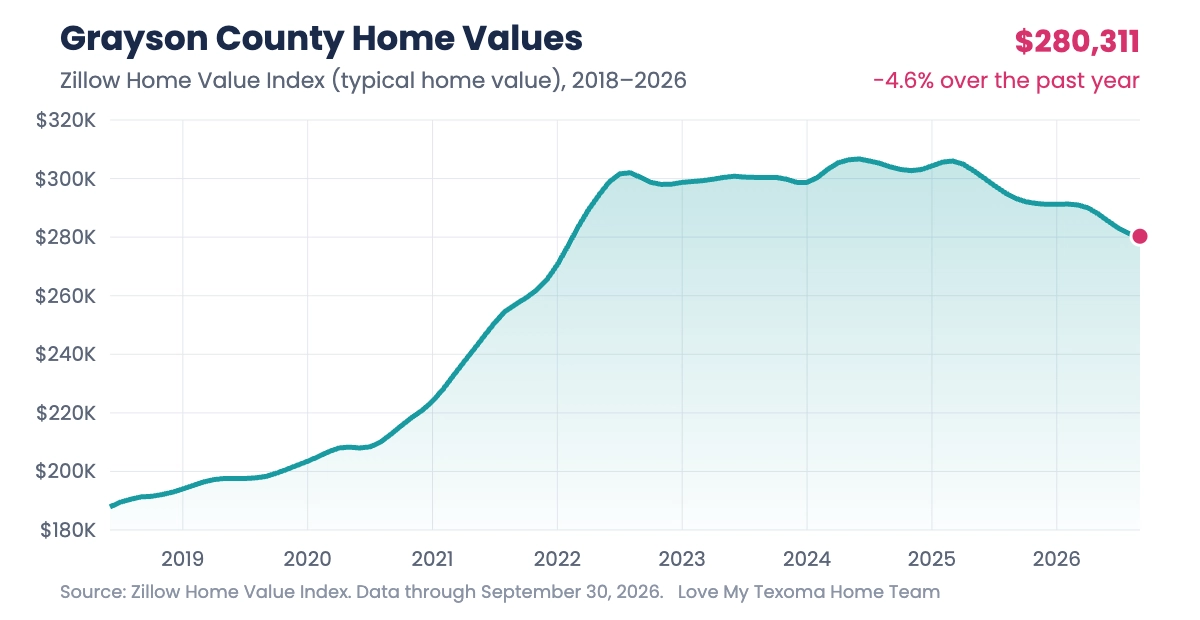
Source: Zillow Home Value Index, all homes, data through September 30, 2026.
Zillow Home Value Index: Zillow's Home Value Index for Grayson County sits at $288,077, down 4.9% year-over-year, with a median of 48 days to pending (Source: Zillow, as of July 31, 2026). Median Sale Price: Over the three months ending in July 2026, the median home sale price in Grayson County was $301,615, down 2.7% from a year earlier. Days on Market: Homes are taking longer to sell — a median of 74 days, up 11 days compared to the same period last year. Volume: 212 homes sold in that window, down nearly 10% year-over-year (Source: Redfin). Takeaway: Grayson County, home to Sherman and Denison, has shifted toward buyers over the past year; more time on market and slightly softer prices mean more negotiating leverage for buyers willing to move now, even with rates elevated. Sellers should price realistically from day one and expect more flexibility on repairs or closing costs than they may have needed to offer in 2024–2025.
Cooke County Housing Market Overview (Zillow, data through september 30, 2026)
| Typical Home Value (Zillow Home Value Index) | $318,246 |
| 1-Year Value Change | -0.8% |
| For-Sale Inventory | 321 (September 30, 2026) |
| New Listings | 46 (September 30, 2026) |
| Median Sale-to-List Ratio | 0.968 (August 31, 2026) |
| Median Sale Price | $343,772 (August 31, 2026) |
| Median List Price | $404,817 (September 30, 2026) |
| Percent of Sales Over List Price | 13.2% (August 31, 2026) |
| Percent of Sales Under List Price | 68.7% (August 31, 2026) |
| Median Days to Pending | 68 (September 30, 2026) |
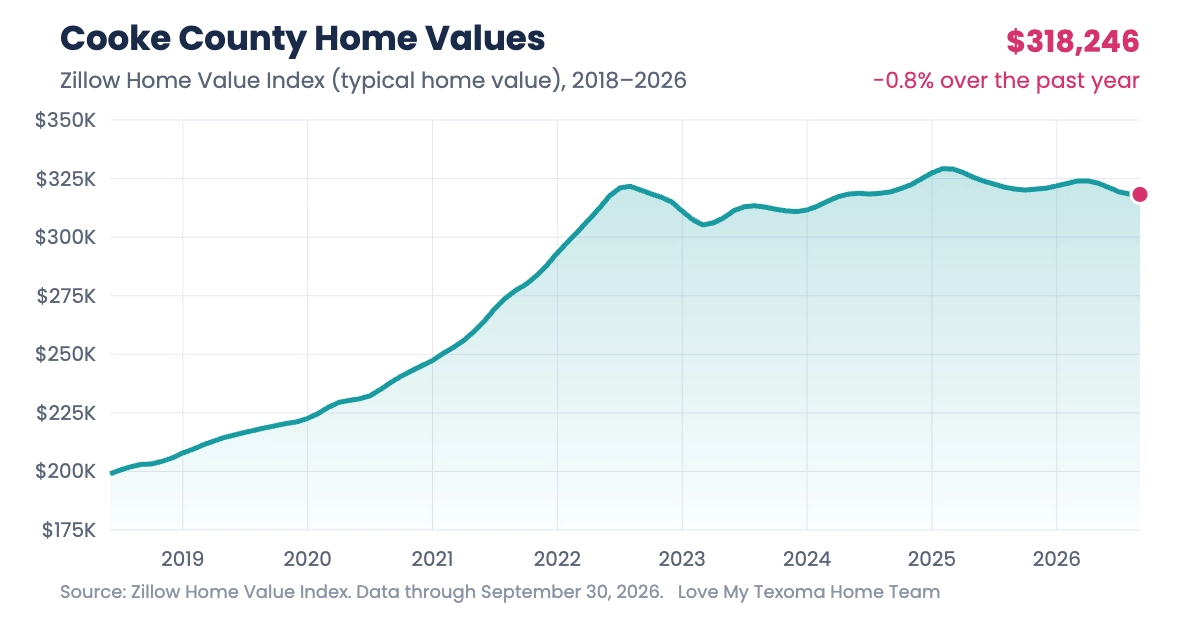
Source: Zillow Home Value Index, all homes, data through September 30, 2026.
Median Sale Price: Over the three months ending in August 2026, the median home sale price in Cooke County was $324,110, down 7.1% from a year earlier. Days on Market: A median of 110 days, up 20 days compared to the same period last year. Volume: 46 homes sold in that window, up 13.1% year-over-year (Source: Redfin). Zillow does not publish a dedicated home-value index for Cooke County, so Redfin's sale-price data is the most complete county-level source available. Takeaway: Cooke County is sitting on the softer end of our region right now — prices down, days on market up, but sales volume ticking up, which tells us buyers are still there, they're just taking their time and negotiating harder. Good news for a patient buyer; a reason for sellers to lean on real staging and sharp pricing rather than wishful thinking.
Bryan County Housing Market Overview (Zillow, data through september 30, 2026)
| Typical Home Value (Zillow Home Value Index) | $228,588 |
| 1-Year Value Change | -0.7% |
| For-Sale Inventory | 306 (September 30, 2026) |
| New Listings | 53 (September 30, 2026) |
| Median Sale-to-List Ratio | 0.982 (August 31, 2026) |
| Median Sale Price | $232,667 (August 31, 2026) |
| Median List Price | $282,667 (September 30, 2026) |
| Percent of Sales Over List Price | 23.7% (August 31, 2026) |
| Percent of Sales Under List Price | 59.2% (August 31, 2026) |
| Median Days to Pending | 51 (September 30, 2026) |
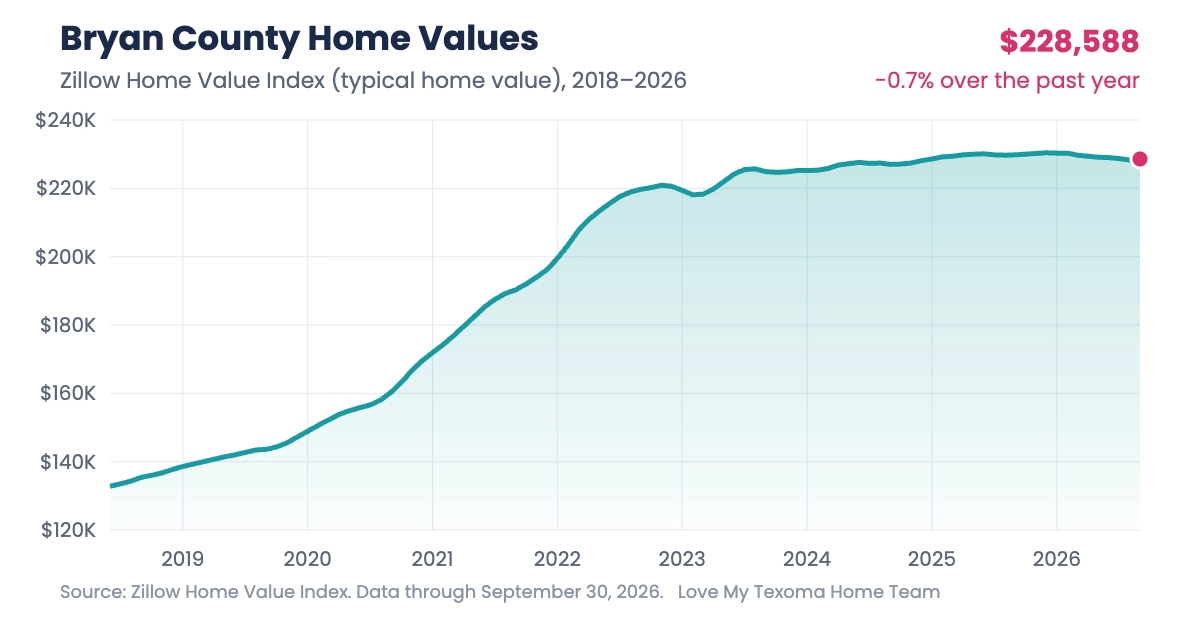
Source: Zillow Home Value Index, all homes, data through September 30, 2026.
Median Sale Price: Bryan County's most recently published county-level figures show a median home sale price of $255,000, up 5.2% year-over-year, with an average of 57 days on market (up from 24 a year earlier) and 26 homes sold in the period, down from 28 (Source: Redfin). Zillow does not publish a dedicated home-value index for Bryan County. We'll flag this directly: rural counties like Bryan don't generate enough monthly sales for data providers to refresh every county-level figure every month, so treat this as the most recent complete snapshot rather than a real-time read — your Love My Texoma Home agent can pull live, address-specific comps any time. Takeaway: Bryan County, home to Durant, continues to see firm pricing even as days on market stretch out — a sign that well-priced homes are still finding buyers, just not as fast as they were a year or two ago.
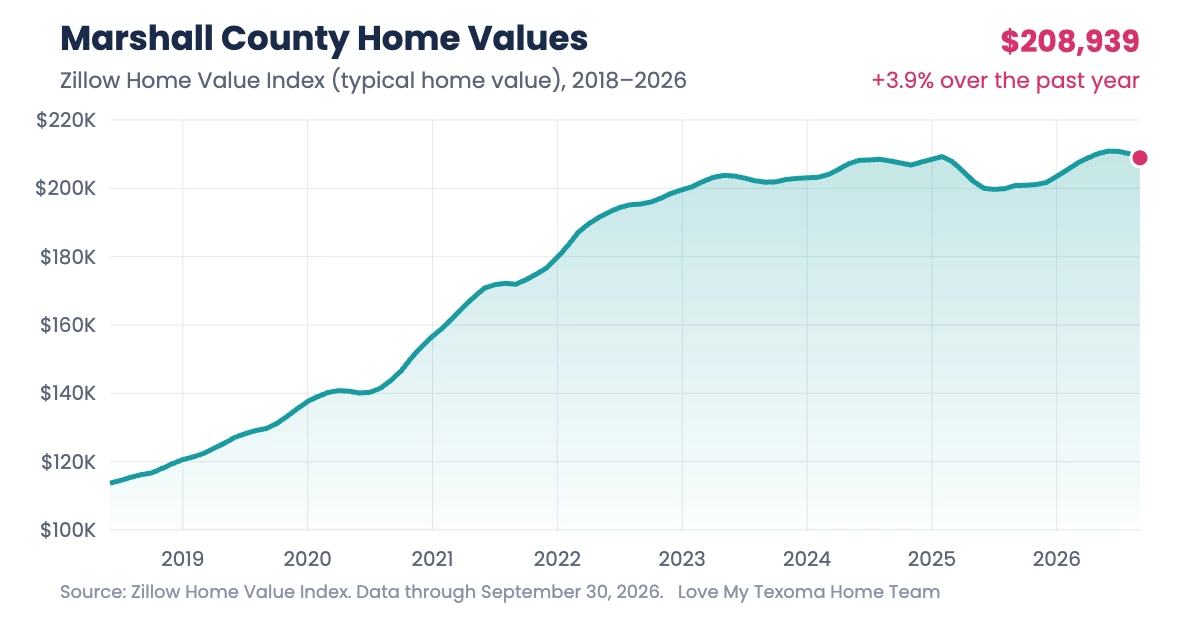
Marshall County Housing Market Overview (Zillow, data through september 30, 2026)
| Typical Home Value (Zillow Home Value Index) | $208,939 |
| 1-Year Value Change | +3.9% |
| For-Sale Inventory | 190 (September 30, 2026) |
| New Listings | 22 (September 30, 2026) |
| Median List Price | $382,500 (September 30, 2026) |
Source: Zillow Home Value Index, all homes, data through September 30, 2026.
Zillow Home Value Index: Zillow's Home Value Index for Marshall County is $208,939, up 3.9% year-over-year (Source: Zillow, as of September 30, 2026). Median Sale Price: Over the three months ending in June 2026, Redfin's median sale price for Marshall County was $282,453, down 15.1% from a year earlier, with a median of just 16 days on market and 8 homes sold in the period (Source: Redfin). Takeaway: Notice the gap between Zillow's value index (which tracks typical home value, including homes not currently for sale) and Redfin's sale-price figure (which reflects a small handful of actual closings) — in a county this size, a few lake-house sales can swing the median hard. Marshall County, home to Madill and the Lake Texoma shoreline, is still moving fast when a home is priced right; the short days-on-market number backs that up even as the median price cools.
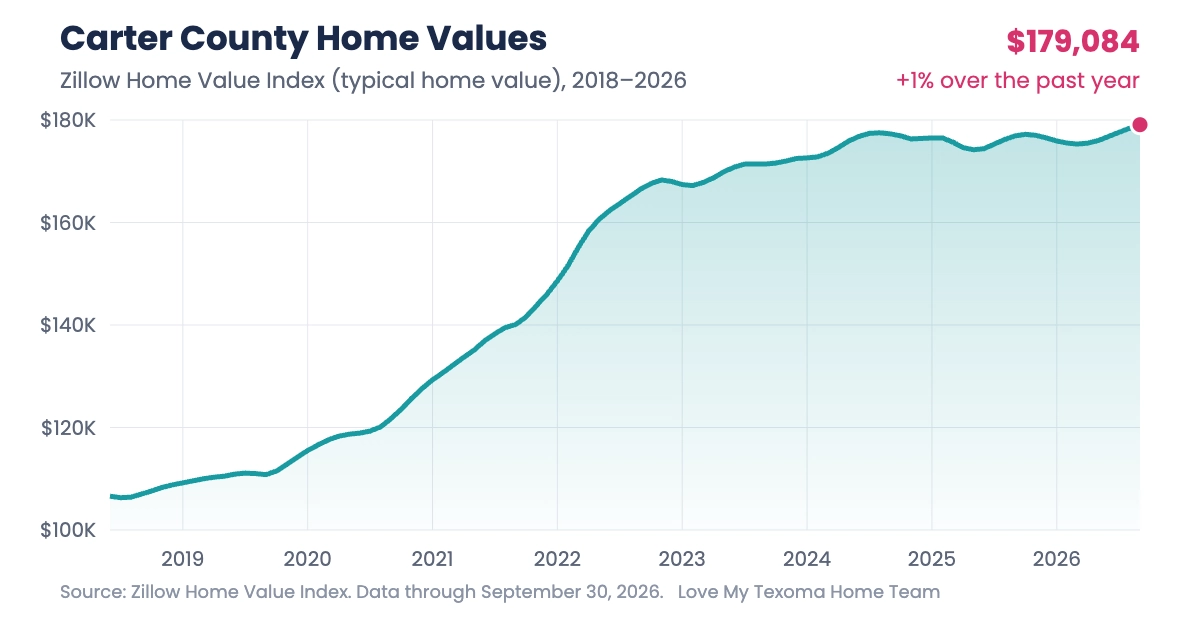
Carter County Housing Market Overview (Zillow, data through september 30, 2026)
| Typical Home Value (Zillow Home Value Index) | $179,084 |
| 1-Year Value Change | +1% |
| For-Sale Inventory | 331 (September 30, 2026) |
| New Listings | 55 (September 30, 2026) |
| Median Sale-to-List Ratio | 0.972 (August 31, 2026) |
| Median Sale Price | $203,167 (August 31, 2026) |
| Median List Price | $259,250 (September 30, 2026) |
| Percent of Sales Over List Price | 14.5% (August 31, 2026) |
| Percent of Sales Under List Price | 66.1% (August 31, 2026) |
| Median Days to Pending | 61 (September 30, 2026) |
Source: Zillow Home Value Index, all homes, data through September 30, 2026.
Median Sale Price: Over the three months ending in June 2026, the median home sale price in Carter County was $214,395, up 28.4% from a year earlier, with a median of 53 days on market (down 6 days year-over-year) and 53 homes sold, up 27.3% (Source: Redfin). Zillow does not publish a dedicated home-value index for Carter County. Takeaway: Carter County, home to Ardmore, is the standout this month — prices up sharply, days on market down, and sales volume climbing. That combination points to real demand, not just a thin sample skewing the numbers. If you're selling in Ardmore or around Lake Murray, this is a good month to be confident about your asking price.
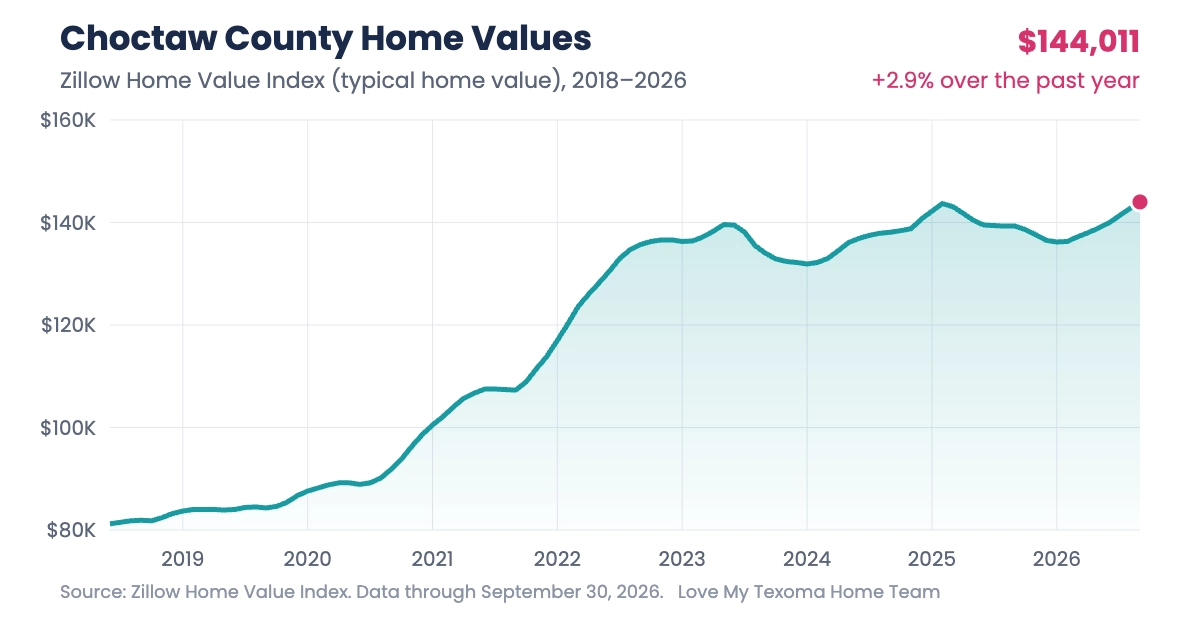
Choctaw County Housing Market Overview (Zillow, data through september 30, 2026)
| Typical Home Value (Zillow Home Value Index) | $144,011 |
| 1-Year Value Change | +2.9% |
| For-Sale Inventory | 74 (September 30, 2026) |
| New Listings | 9 (September 30, 2026) |
| Median List Price | $299,300 (September 30, 2026) |
Source: Zillow Home Value Index, all homes, data through September 30, 2026.
Median Sale Price: Over the three months ending in June 2026, the median home sale price in Choctaw County was $132,127, up 3.6% from a year earlier, with a median of 50 days on market, up 36 days compared to last year. Only 4 homes sold in the period (Source: Redfin). Zillow does not publish a dedicated home-value index for Choctaw County. Takeaway: With a sample this small, we'd rather be honest than precise: 4 sales isn't enough to call a trend, it's enough to tell you Choctaw County is a thin, patient market centered around Hugo. Pricing still held up year-over-year, which is the more reliable signal here.
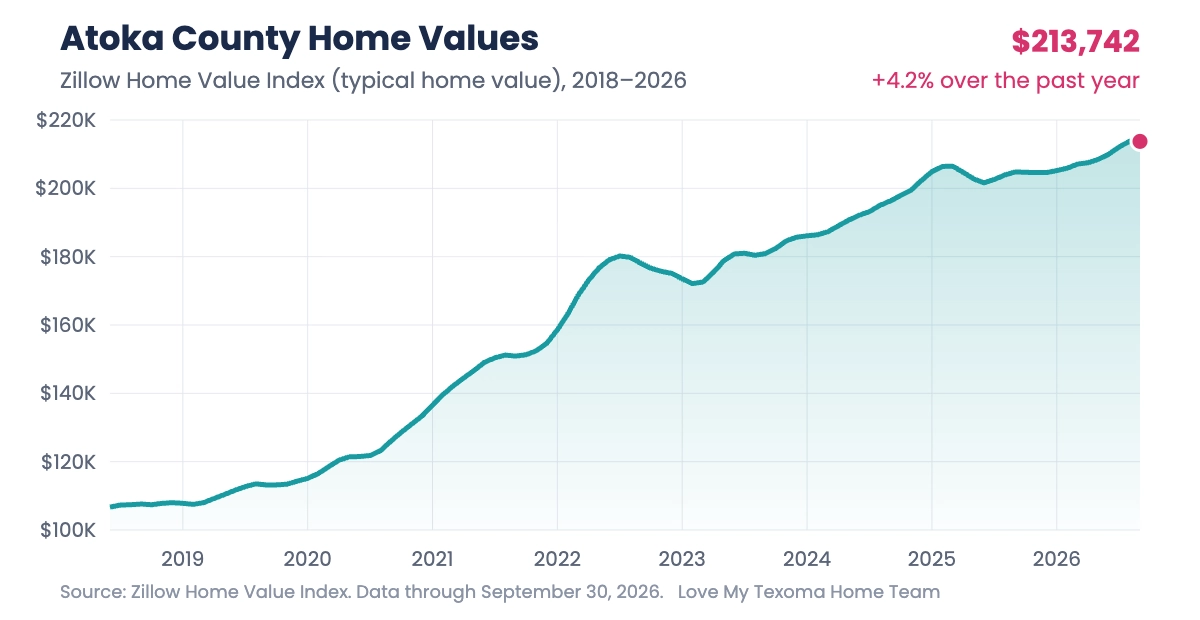
Atoka County Housing Market Overview (Zillow, data through september 30, 2026)
| Typical Home Value (Zillow Home Value Index) | $213,742 |
| 1-Year Value Change | +4.2% |
| For-Sale Inventory | 65 (September 30, 2026) |
| New Listings | 9 (September 30, 2026) |
| Median List Price | $288,333 (September 30, 2026) |
Source: Zillow Home Value Index, all homes, data through September 30, 2026.
Median Sale Price: Atoka County has no dedicated county-level page on Zillow or Redfin, so we're using data for the city of Atoka, the county seat, as the best available proxy. Over the three months ending in September 2026, the median home sale price in Atoka was $127,439, down 31.1% from a year earlier, with a median of 116 days on market (up 51 days year-over-year) and just 5 homes sold, down 27.5% (Source: Redfin). Takeaway: This is the softest reading in our service area this month — fewer sales, longer time on market, and a meaningful price pullback. In a market this small, that can reflect a couple of unusual sales as easily as a real shift, so if you're buying or selling in Atoka County, lean on a local agent who can walk the actual comps with you rather than this county-wide number alone.
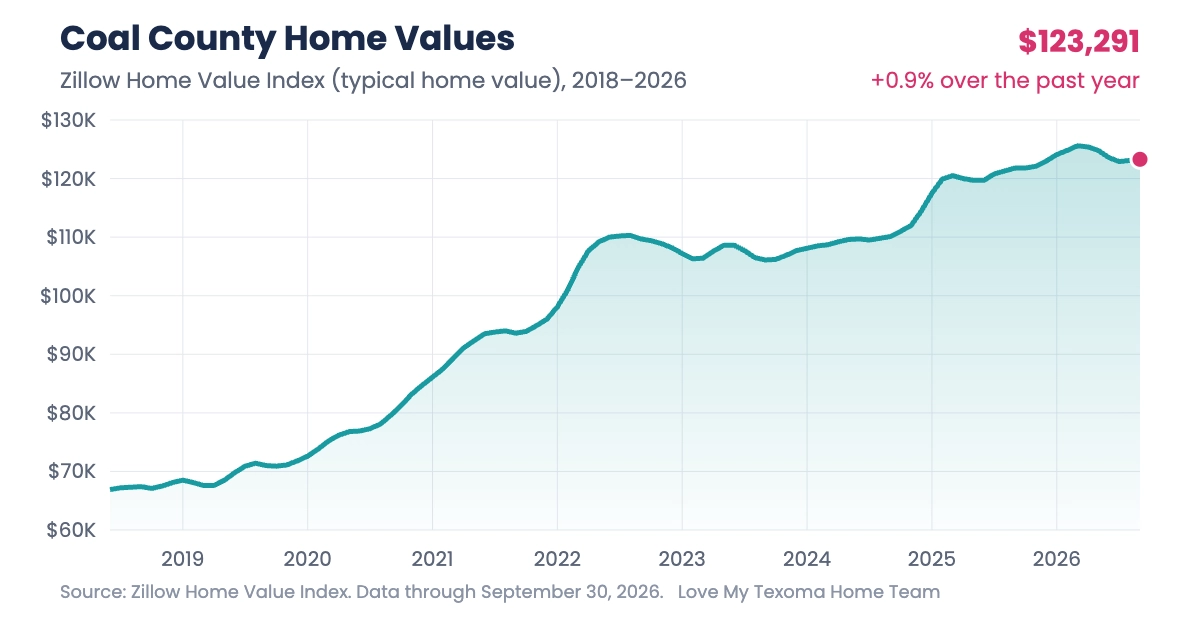
Coal County Housing Market Overview (Zillow, data through september 30, 2026)
| Typical Home Value (Zillow Home Value Index) | $123,291 |
| 1-Year Value Change | +0.9% |
| For-Sale Inventory | 19 (September 30, 2026) |
| New Listings | 3 (September 30, 2026) |
| Median List Price | $266,000 (September 30, 2026) |
Source: Zillow Home Value Index, all homes, data through September 30, 2026.
Zillow Home Value Index: Zillow's Home Value Index for Coal County is $123,291, up 0.9% year-over-year (Source: Zillow, as of September 30, 2026). Redfin's recent-sales data for Coal County is based on a single closed sale in the latest period, which isn't a reliable median, so we're not citing it here. Takeaway: Coal County, home to Coalgate, is the smallest market we track — values are essentially flat year-over-year per Zillow's index, and that steadiness is honestly the headline. This is not a market defined by bidding wars or price cuts; it moves slowly in both directions.
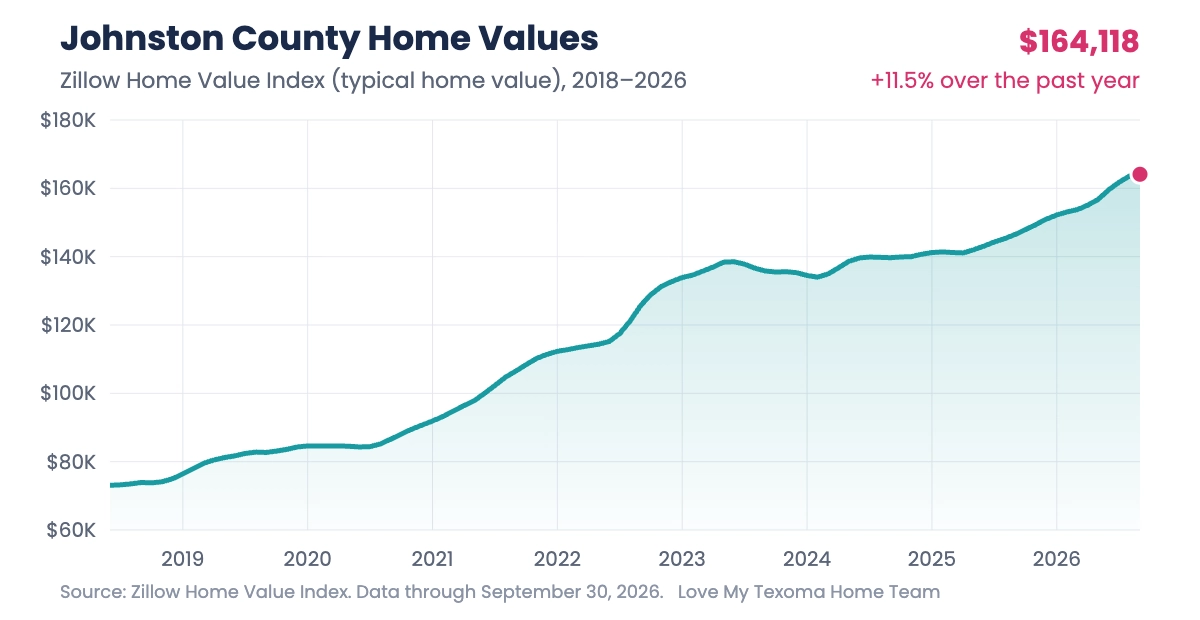
Johnston County Housing Market Overview (Zillow, data through september 30, 2026)
| Typical Home Value (Zillow Home Value Index) | $164,118 |
| 1-Year Value Change | +11.5% |
| For-Sale Inventory | 43 (September 30, 2026) |
| Median List Price | $362,325 (September 30, 2026) |
Source: Zillow Home Value Index, all homes, data through September 30, 2026.
Median Sale Price: The most recent county-level data Redfin has published for Johnston County shows a median home sale price of $85,000, down 61.4% from a year earlier (Source: Redfin). We want to be upfront about this one: that figure is dated November 2025, and Zillow doesn't publish a county-level index here either — Johnston County simply doesn't generate enough monthly sales for either platform to refresh the number often. A 61% swing in a median is almost always a sign of which specific homes sold, not a real 61% drop in value. Takeaway: If you're buying or selling in Tishomingo or anywhere in Johnston County, county-wide stats like this one are close to meaningless — talk to us about actual recent comps on your street.
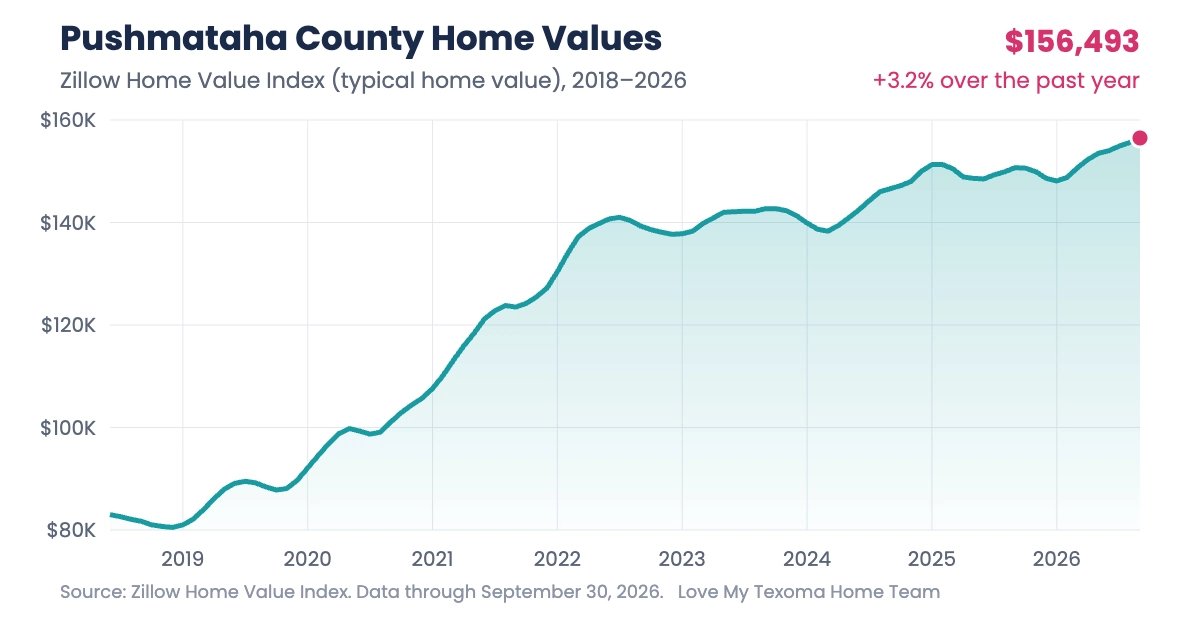
Pushmataha County Housing Market Overview (Zillow, data through september 30, 2026)
| Typical Home Value (Zillow Home Value Index) | $156,493 |
| 1-Year Value Change | +3.2% |
| For-Sale Inventory | 90 (September 30, 2026) |
| New Listings | 12 (September 30, 2026) |
| Median List Price | $266,633 (September 30, 2026) |
Source: Zillow Home Value Index, all homes, data through September 30, 2026.
Median Sale Price: Redfin's most recent published figure for Pushmataha County shows a median home sale price of $240,000, down 30.1% from a year earlier (Source: Redfin). That data is labeled May 2025, and Zillow has no dedicated index for this county either — like Johnston County, Pushmataha's sales volume is too thin for either platform to update monthly. Takeaway: Pushmataha County, anchored by Antlers, is the most rural market in our service area. Treat any county-wide average here as a rough signal at best; an actual walkthrough of recent comparable sales will tell you far more than this number can.
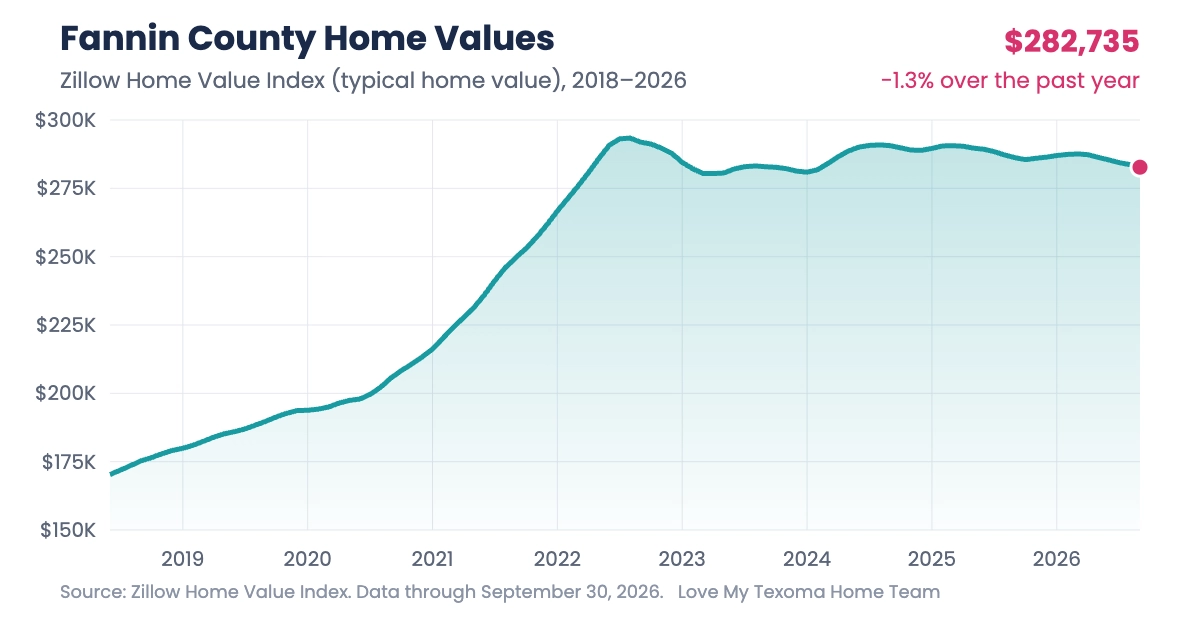
Fannin County Housing Market Overview (Zillow, data through september 30, 2026)
| Typical Home Value (Zillow Home Value Index) | $282,735 |
| 1-Year Value Change | -1.3% |
| For-Sale Inventory | 344 (September 30, 2026) |
| New Listings | 48 (September 30, 2026) |
| Median Sale-to-List Ratio | 0.983 (August 31, 2026) |
| Median Sale Price | $322,500 (August 31, 2026) |
| Median List Price | $322,333 (September 30, 2026) |
| Percent of Sales Over List Price | 21.6% (August 31, 2026) |
| Percent of Sales Under List Price | 60.9% (August 31, 2026) |
| Median Days to Pending | 52 (September 30, 2026) |
Source: Zillow Home Value Index, all homes, data through September 30, 2026.
Zillow Home Value Index: Zillow's Home Value Index for Fannin County is $279,418, down 1.1% year-over-year, with a median of 97 days to pending (Source: Zillow). Takeaway: Fannin County, home to Bonham and the Lake Fannin area, is holding fairly steady — a slight dip in typical value but a long runway to a pending contract, which tells buyers they can take their time and sellers should price with patience in mind rather than expecting a quick weekend sale.
Collin County Housing Market Overview (Zillow, data through september 30, 2026)
| Typical Home Value (Zillow Home Value Index) | $477,505 |
| 1-Year Value Change | -4.7% |
| For-Sale Inventory | 6,293 (September 30, 2026) |
| New Listings | 1,305 (September 30, 2026) |
| Median Sale-to-List Ratio | 0.983 (August 31, 2026) |
| Median Sale Price | $509,117 (August 31, 2026) |
| Median List Price | $521,333 (September 30, 2026) |
| Percent of Sales Over List Price | 13.2% (August 31, 2026) |
| Percent of Sales Under List Price | 68.5% (August 31, 2026) |
| Median Days to Pending | 47 (September 30, 2026) |
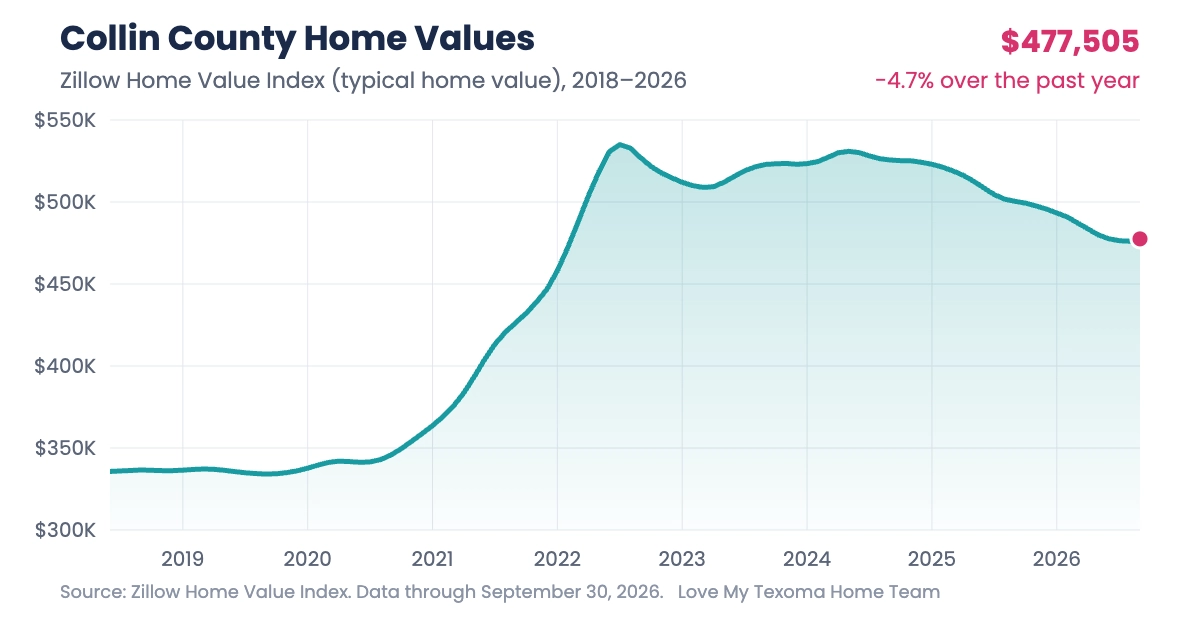
Source: Zillow Home Value Index, all homes, data through September 30, 2026.
Median Sale Price: Over the three months ending in August 2026, the median home sale price in Collin County was $458,466, essentially flat year-over-year (down 0.41%), with a median of 63 days on market (up 2 days) and 1,457 homes sold, down 6.7% (Source: Redfin). Takeaway: Collin County is the largest, most liquid market in our service area by far — over a thousand closings a quarter — and it's landed in a genuinely balanced spot: prices flat, days on market up only slightly. For buyers priced out of Dallas-area premiums, Collin County's more affordable edges and easy access north toward the lake remain a draw; sellers here are dealing with real competition from new construction, so presentation matters.
The throughline across all twelve counties we serve this month is more time on market and a lot more local variation than a single regional headline can capture — from Carter County's sharp price gains to Atoka County's pullback, two counties forty minutes apart are telling very different stories right now. Layer in the national picture (63% more sellers than buyers, the widest gap on record) and the message is consistent: buyers who can qualify have more leverage than they've had in years, almost everywhere in our region. For buyers: use the extra days on market to negotiate on price, repairs, or a rate buydown, and don't assume every listing is priced where it needs to be. For sellers: pricing accurately from day one matters more than it did during the frantic pace of a couple of years ago; strong photos, staging, and smart timing shorten the road to a solid offer, and in our smaller rural counties, a sharp local agent matters even more than the county-wide numbers do. If you're weighing whether now is the right time to make a move, our guide to working with a local Realtor at Lake Texoma walks through how a local agent reads these shifts county by county.
Every county in the Texoma region tells a slightly different story right now, and national headlines about mortgage rates and seller-buyer gaps rarely capture what's happening on a specific street in Sherman, Durant, Ardmore, or Madill. If you're thinking about buying or selling anywhere around Lake Texoma — from Collin County down to Pushmataha County — reach out to the Love My Texoma Home Team. We track these numbers county by county, all year, and we're happy to walk you through what they mean for your specific situation. Search current Grayson County listings or contact us today to get started.


As of Freddie Mac's Primary Mortgage Market Survey for the week ending October 29, 2026, the average 30-year fixed mortgage rate is 7.24%, with 15-year fixed rates averaging 6.60% (Source: Freddie Mac). This is a national average; individual rates vary by lender, credit profile, and loan type, so buyers should get a current quote from a local lender before making decisions.
Nationally, yes — as of September 2026, Redfin counted 63% more active home sellers than active home buyers, the widest gap since it began tracking this in 2013 (Source: Redfin). That's a national figure, though — our local Texoma counties are smaller markets where conditions vary a lot county by county, which is why we break out data for all twelve counties we serve above rather than relying on the national number alone.
It varies by county, but most of the region is trending toward buyers: homes are taking longer to sell in Grayson, Cooke, and Bryan counties compared to a year ago, and prices have softened slightly in Grayson, Cooke, and Marshall counties. Marshall County is the exception, with homes selling notably faster than last year.
Homes in Grayson County sold in a median of 74 days over the three months ending in July 2026, up from 63 days during the same period the year before, according to Redfin.
Results are mixed by county: Grayson, Cooke, and Marshall counties all saw median sale prices decline year-over-year as of mid-2026, while Bryan County and the city of Durant have seen prices hold roughly flat to slightly up. Local conditions vary block by block, so a comparative market analysis is the best way to price a specific home.
Timing the market perfectly is difficult, and rates have moved in both directions over the past two years. Many buyers choose to purchase when they find the right home and negotiate on price or terms given today's rate environment, with the option to refinance later if rates fall. Talk to a local lender about current rate-lock and buydown options before deciding.
Guides & Resources
For Buyers
Buying a Home in TexomaFirst-Time Home Buyer ProgramsNative American Homebuyer ProgramsThe Closing ProcessNew Construction GuideBuying Land & AcreageLenders & Local Pros